An example of Visualisation using the GUI
In this section we have provided an easy step-by-step Usage Example of Visualisation with LIBTwinSVM. For more information on the application and its features, go to this link.
Step 1: Data Import
- To visualize a model, the first step is to import the data. In the following section, you have shown how to import data and how to use some of the application features.
- By default, the application starts on the Data tab.

- By clicking on the Open button in the Import box, the File Explorer will be open and you can then choose the file you want to train.

- You can choose the file content separator if it is other than comma.
- In Read box in Data tab, you can choose how you want the data to be processed by the application. You may want to Normalize or Shuffle the data.
- Then you must click on Load Button, and the data will be imported and also displayed in the feature box.

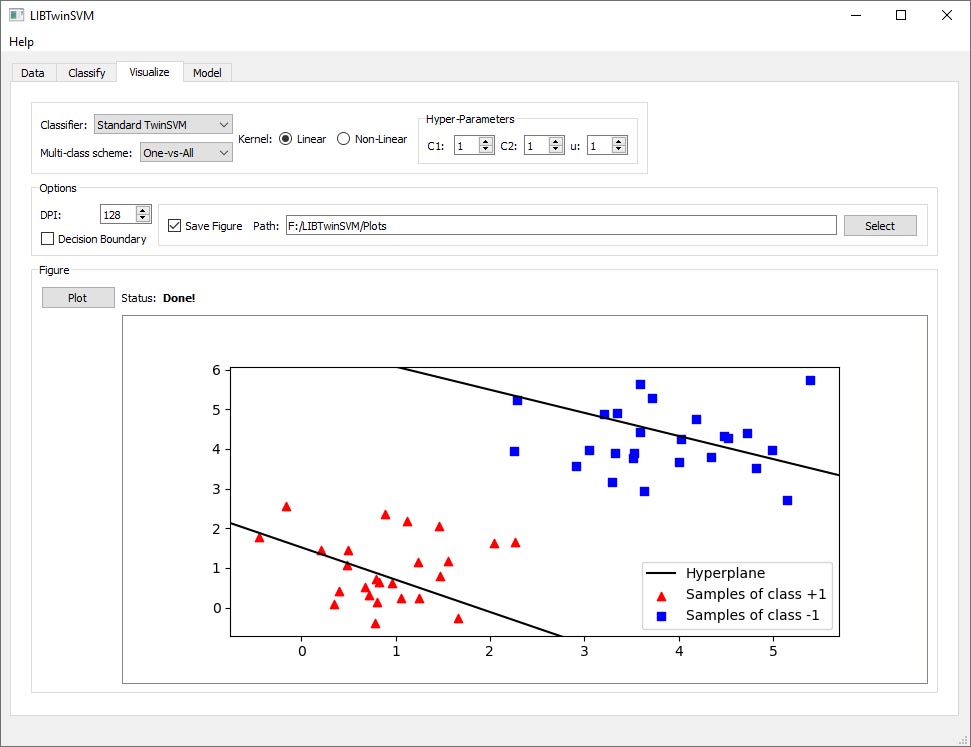
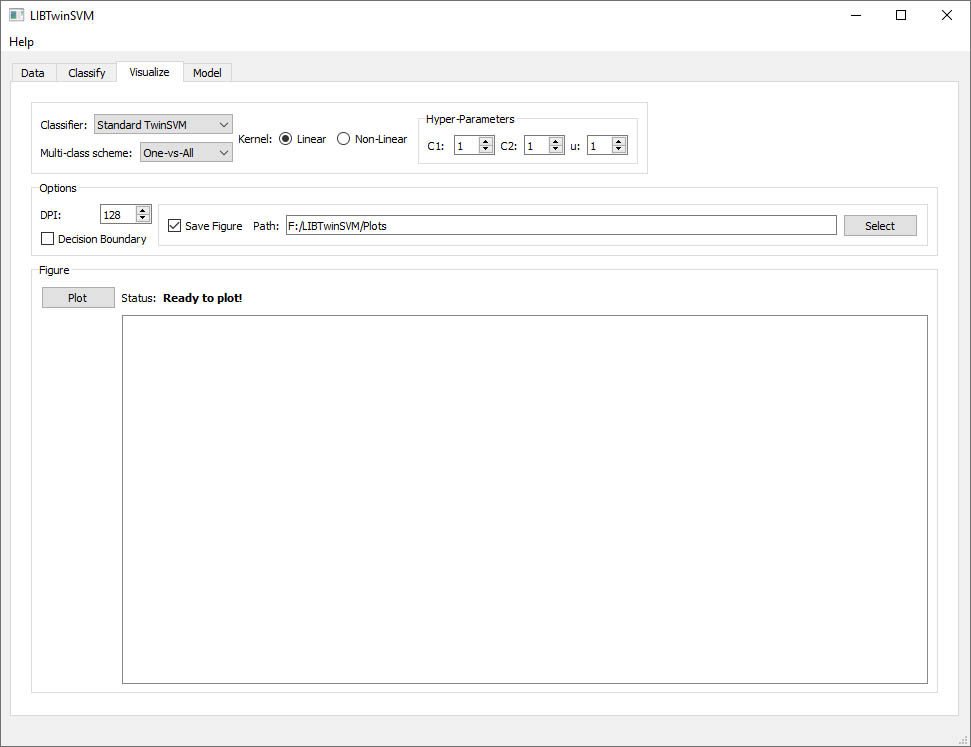
Step 2: Visualisation
- So far, the data is already imported and you are going to see how Visualize tab works.
- You switch the tabs to Visualize tab.

- Now you have several options to choose or modify such as Classifier, Kernel type, Hyper Parameters and DPI which it determines the output plot quality.
- In the Options box in Visualize tab, there is a check-box for saving the figure. By checking that check-box, you need to select a path, so the application can save the final figure.
- In the final step by Clicking on the Plot button, the plot will be displayed in the figure box.